


Transcriptome-metabolome integration reveals MYB/WRKY-RGA network and phenylalanine metabolism in potato late blight resistance
Xiaofeng Liu, Huan Zou, Honghao Li, Zhonghan Fan, Xiangquan Fan, Yuhang Zhu, Qinghua Chen, Rongping Hu
BMC Plant Biol.; 2026 Apr 11; 26(1):760. doi: 10.1186/s12870-026-08429-6.
Abstract
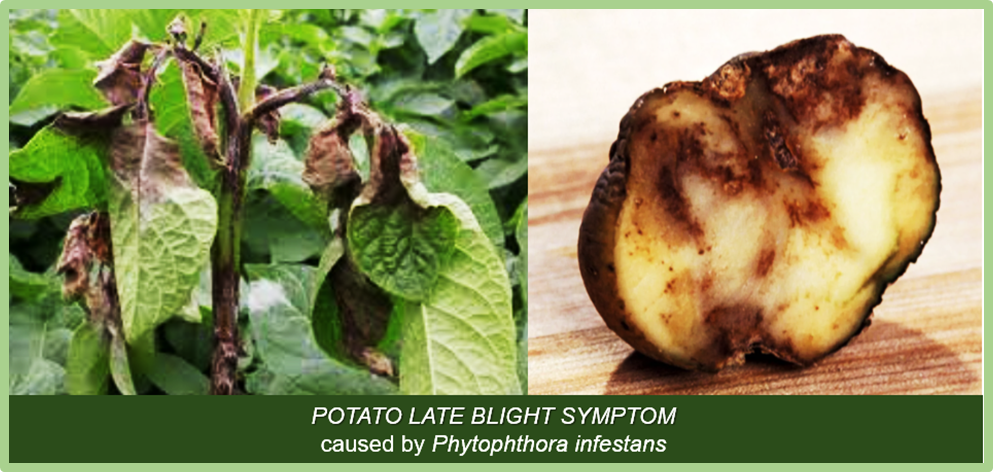
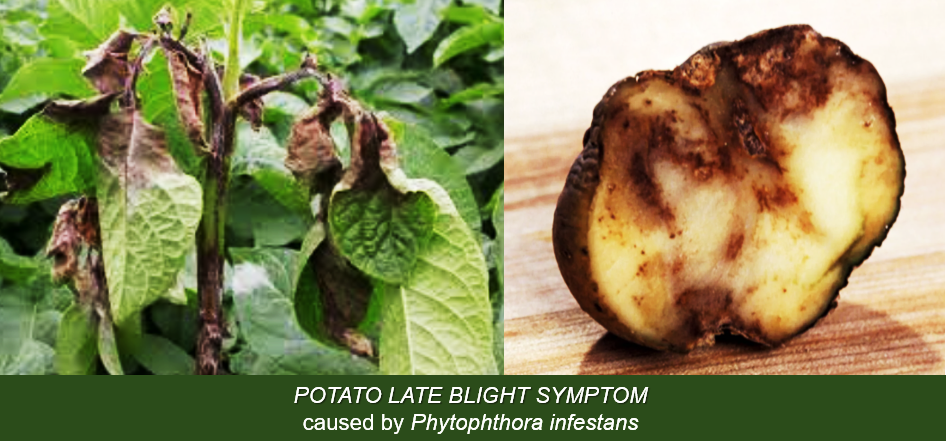
Background: Late blight, caused by Phytophthora infestans, is one of the most destructive diseases threatening global potato production.
Methods: To investigate the molecular basis of resistance, we conducted integrated transcriptomic and metabolomic analyses using leaves of the resistant cultivar DY2 and the susceptible cultivar FW during P. infestans infection.
Results: Phenotypic evaluation showed that DY2 displayed markedly stronger resistance than FW. Transcriptome analysis revealed that FW had substantially more differentially expressed genes (DEGs) at 96 h post-infection (hpi), indicating greater infection pressure. Across six comparisons of each treatment time point (24, 48, and 96 hpi) with 0 hpi, DEGs were enriched in similar defense-related pathways, with 3,181 core DEGs identified. Co-expression network analysis highlighted the central roles of MYB and WRKY transcription factors (TFs) in resistance. KEGG enrichment further showed that jasmonic acid (JA) and salicylic acid (SA) signaling, together with MAPK pathways, were significantly activated during infection. Metabolomic profiling combined with weighted gene co-expression network analysis (WGCNA) revealed that phenylalanine metabolism contributes critically to defense, with early activation of the key enzyme PAL closely linked to resistance in DY2.
Conclusions: Overall, this study provides a systematic view of transcriptional and metabolic responses of potato to P. infestans and offers valuable insights and candidate genes for breeding late blight–resistant cultivars.
See https://pubmed.ncbi.nlm.nih.gov/41963789/
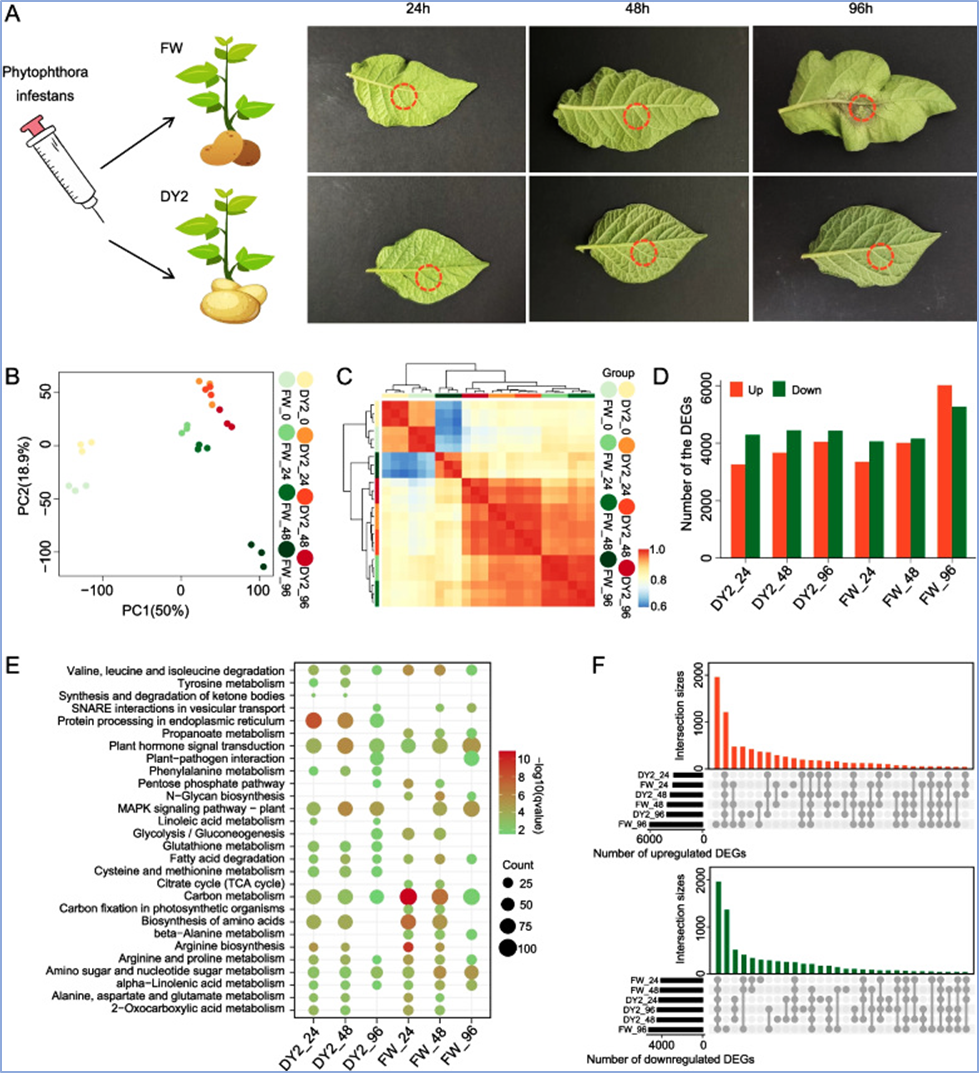
Fig. 1: Transcriptomic changes in potato leaves during P. infestans infection. A Phenotypes of potato leaves after P. infestans inoculation. B–C PCA (B) and hierarchical clustering heatmap (C) based on gene expression levels. D Bar plots showing the numbers of DEGs in two cultivars (DY2 and FW) at three time points (24, 48, and 96 hpi) after infection compared with the control (0 hpi). E Bubble plots illustrating KEGG enrichment results of DEGs. F UpSet plots of upregulated and downregulated DEGs among different comparisons
Views: 112