


PeanutOmics: A comprehensive platform with an integrative multi-omics atlas for peanut research
Hongzhang Xue, Kunkun Zhao, Xiaorui Dong, Qian Ma, Sa Sa Hu, Zenghui Cao, Yang Shu, Yanzhe Li, Xiaoxiang Huang, Kai Zhao, Ding Qiu, Wenguang Shao, Rui Ren, Zhongfeng Li, Fangping Gong, Xingli Ma, Chaochun Wei, Dongmei Yin
Plant Commun.; 2026 Jan 12; 7(1):101622. doi: 10.1016/j.xplc.2025.101622.
Abstract
Peanut (Arachis hypogaea) is an economically important legume crop, but a comprehensive understanding of its gene expression dynamics across developmental stages remains limited. To address this gap, we constructed an integrative multi-omics atlas spanning transcriptomic, proteomic, and metabolomic profiles across 22 primary vegetative and reproductive tissues. We identified 53 030 expressed genes at the transcript level, 12 826 with protein evidence, and 2035 metabolites. Among these, 2147 genes encode novel proteins, and 274 produce microproteins. Functional analyses identified WDR13, TANGO, RPP13, DEF3, SLR1-BP, and SLE2 as key genes involved in development and stress responses. Co-expression analysis grouped genes into 24 modules, many of which exhibited tissue-specific expression patterns. Pathway enrichment and correlation network analyses further highlighted the critical roles of the IAA and ARF gene families in hormone signaling and cell growth, particularly in peg development. To facilitate data accessibility and downstream research, we developed PeanutOmics (https://cgm.sjtu.edu.cn/PeanutOmics), a user-friendly web platform that integrates multi-omics datasets with advanced analytical tools. This atlas offers a valuable resource for understanding gene and metabolite regulation in peanut and lays the groundwork for advanced molecular breeding to improve crop productivity.
See https://pubmed.ncbi.nlm.nih.gov/41277040/
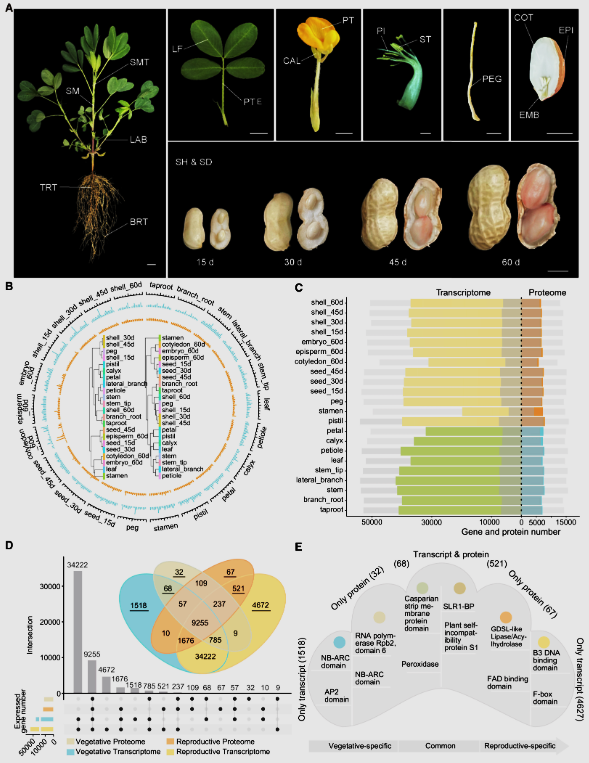
Figure 1: Proteomic and transcriptomic maps of 22 peanut tissues.
(A) Schematic overview of the 22 sampled peanut tissues. These included shell (SH; 15 d, 30 d, 45 d, and 60 d), stem (SM), stem tip (SMT), lateral branch (LAB), taproot (TRT), branch root (BRT), leaf (LF), petiole (PTE), seed (SD; 15 d, 30 d, 45 d, and 60 d; seed at 60 d further subdivided into cotyledon 60 d [COT], episperm 60 d [EPI], and embryo 60 d [EMB]), petal (PT), calyx (CAL), pistil (PI), stamen (ST), and peg. Three biological replicates were collected for each sample.
(B) Circular representation of gene expression profiles across the 22 tissues based on proteomic (blue) and transcriptomic (orange) data. Center, hierarchical clustering of expression profiles from both data types.
(C) Number of genes detected at the transcript and protein levels. Gray bars represent genes with FPKM > 0 or protein expression (ProtExp) > 0 in at least one replicate. Colored bars indicate FPKM > 1 or ProtExp > 1. Dark gray boxes, genes with both FPKM > 1 and ProtExp > 1.
(D) Overlap of identified genes (FPKM > 1 and ProtExp > 1) between the transcriptome and proteome in reproductive and vegetative tissues.
(E) Pfam domain enrichment analysis of tissue-specific genes identified at the transcript and protein levels in reproductive and vegetative tissues.
Views: 170