

WOX11-OsPRX130 module confers rice drought tolerance by maintaining ROS homeostasis in rice root
Mingfang Tan, Yijie Wang, Yu Zhao
Rice (N Y); 2025 Jun 19; 18(1):55. doi: 10.1186/s12284-025-00800-9.
 Abstract
Plants have evolved sophisticated mechanisms to cope with drought stress. A resilient root system, coupled with appropriate levels of reactive oxygen species (ROS), is crucial for optimal growth and increased yield under drought stress. Accumulating studies have shown a strong link between root development, ROS, and drought tolerance. WOX11, as a master regulator of crown root (CR) development in rice, also governs root redox metabolism. However, it remains unknown whether WOX11 modulates ROS homeostasis in roots to facilitate adaptation to drought stress. In this study, we found that WOX11 directly binds to the promoter of the peroxidase gene OsPRX130, thereby enhancing drought tolerance by regulating CR growth. Notably, OsPRX130 is predominantly expressed in rice roots and its expression is induced by drought stress. Knockout of OsPRX130 inhibited CR growth by reducing ROS levels, ultimately compromising the drought tolerance in rice. Taken together, our findings shed light on the mechanism by which WOX11 mediates ROS accumulation through modulating the class III peroxidase gene OsPRX130 during rice CR development. This provides new insights into the functions of PRX genes during CR development. More importantly, our results deepen our understanding of how WOX11 regulates root development to enhance drought tolerance in rice and provide an alternative breeding strategy using WOX11 to control root system architecture for developing crop varieties with high drought adaptability.
See https://pubmed.ncbi.nlm.nih.gov/40536725/

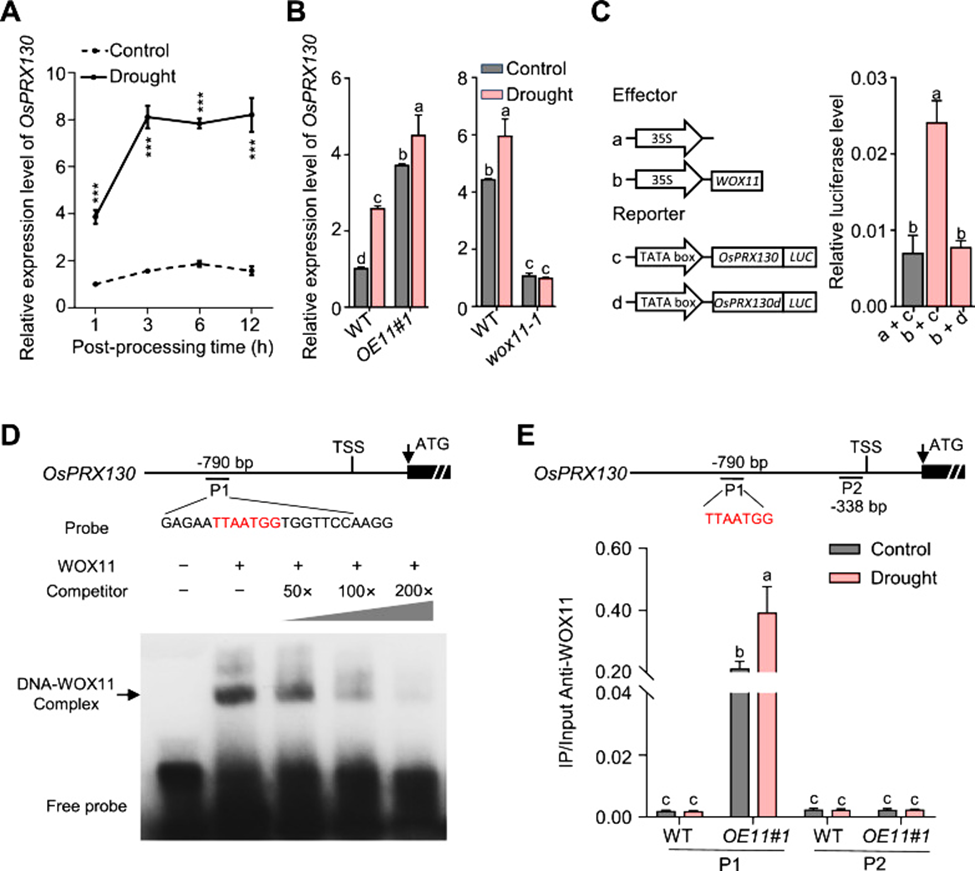
Figure 2
WOX11 positively regulates OsPRX130 during drought stress. A Expression of OsPRX130 in 14-d-old WT under drought treatment for 1 h, 3 h, 6 h, and 12 h. B RT-qPCR analysis of OsPRX130 transcripts in 14-d-old wild type (ZH11, HY), wox11, and WOX11 overexpression plants (OE11#1, OE11#2) under normal conditions or drought treatment for 3 h. OE11 and wox11 were in ZH11 and HY backgrounds, respectively. Data in A and B are means ± SE from three biological replicates. The 2−△△ct method was used for the quantification of relative expression levels. The gene ACTIN1 served as an internal control and PCR signals were normalized to those of ACTIN1 transcripts (set as 1). C Dual-luciferase assay for WOX11 activation of OsPRX130 in rice protoplasts. The 1100 bp promoter (ATG upstream 1100 bp) of the ATG of OsPRX130 was used. OsPRX130d refers to the 1,100 bp OsPRX130 sequence with the TTAATGG motif deleted. A schematic diagram of the effector and reporter used in the co-transfection experiments was shown in the left panel. Dual-luciferase assays showing the transcriptional activities of WOX11 at the OsPRX130 promoter in rice protoplast were shown in the right panel. Data were normalized to the internal LUC reference, which was co-transfected in the assay. D Electrophoretic mobility shift assay (EMSA) of WOX11 protein binding to the TTAATGG motif (WOX11-binding site) within the OsPRX130 promoter. E. coli-produced WOX11 protein was incubated with 5’-biotin-labeled P1 in the absence or presence of 50, 100 or 200 M excess of the corresponding probes and analyzed by electrophoresis. The shifted band is indicated by the arrow. Three biological replicates were performed. E ChIP-qPCR analysis of WOX11 binding to OsPRX130 under normal and drought conditions. Upper panel: Schematic representation of a putative locus of WOX11 binding sites in OsPRX130 genomic sequence. P1 (− 790 bp from ATG) with TTAATGG motif, P2 (− 338 bp from ATG) without TTAATGG motif. Bottom panel: Nuclei from crown roots of wild type (ZH11) and WOX11 overexpression plants (OE11#1) were immunoprecipitated with anti-WOX11. These were analyzed by qPCR using two sets of primers to amplify two regions within OsPRX130 (P1 and P2), as indicated in the top panel. Data are means ± SE of three biological replicates of each experiment (n = 3). Significant differences in A were calculated by the two-tailed t-test (*P < 0.05, **P < 0.01, ***P < 0.001, ns, not significant compared to WT). The significant difference of the data in B, C and E was calculated using one-way ANOVA with Tukey’s multiple comparison test. The significant difference is indicated by different letters in the bar (P < 0.05), the same letter indicates no significant difference
Views: 140