

LUMINIDEPENDENS orchestrates global transcriptional repression in Arabidopsis
Clara Bergis-Ser, Qingyi Wang, Xiaoning He, Maherun Nisa, Vickie Kaiser, Christelle Mazubert, Jeannine Drouin-Wahbi, Rim Brik-Chaouche, Layla Chmaiss, Jelle Van Leene, Geert De Jaeger, Jose Gutierrez-Marcos, Catherine Bergounioux, Clara Bourbousse, David Latrasse, Moussa Benhamed, and Cécile Raynaud
PNAS; December 2 2025; 122 (49) e2527372122; https://doi.org/10.1073/pnas.2527372122
Significance
In a genetic screen designed to identify regulators of the plant replication stress response, we identified the LUMINIDEPENDENS (LD) protein. By combining data obtained through genetic, transcriptomic and epigenomic approaches, we show that loss of LD or its partner FLD mitigate developmental defects caused by replication stress. Beyond this potential role during DNA replication, we show that these two proteins are general repressors of transcription, likely acting through their interaction with the Mediator complex and modulating RNA Pol II activity.
Abstract
Genomic integrity is constantly challenged by transcription/replication conflicts, a major source of replication stress and instability across all life forms. While extensive studies have elucidated mechanisms for resolving transcription/replication conflicts in animals, yeast, and prokaryotes, their counterparts in plants remain largely unexplored. Through a forward genetic screen, we identified LUMINIDEPENDENS (LD), previously known for its role in regulating the flowering repressor FLC, as a key factor in mitigating replication stress in plants. Notably, transcriptomic analyses reveal that LD loss results in the upregulation of over half of the Arabidopsis genes, placing LD as a global transcriptional repressor. Consistent with this role, LD directly binds a substantial portion of the Arabidopsis genome and interacts with the MED18 subunit of the Mediator complex to modulate RNA polymerase II phosphorylation. These findings uncover a fundamental function of LD in fine-tuning transcription at a genome-wide scale, with potentially an additional role in suppressing transcription–replication conflicts by locally dampening transcription and promoting replication fork progression. Our work highlights an intriguing genome-protective strategy in plants, that could shed light on mechanisms involved in transcription–replication conflict management in eukaryotic systems.
See https://www.pnas.org/doi/10.1073/pnas.2527372122
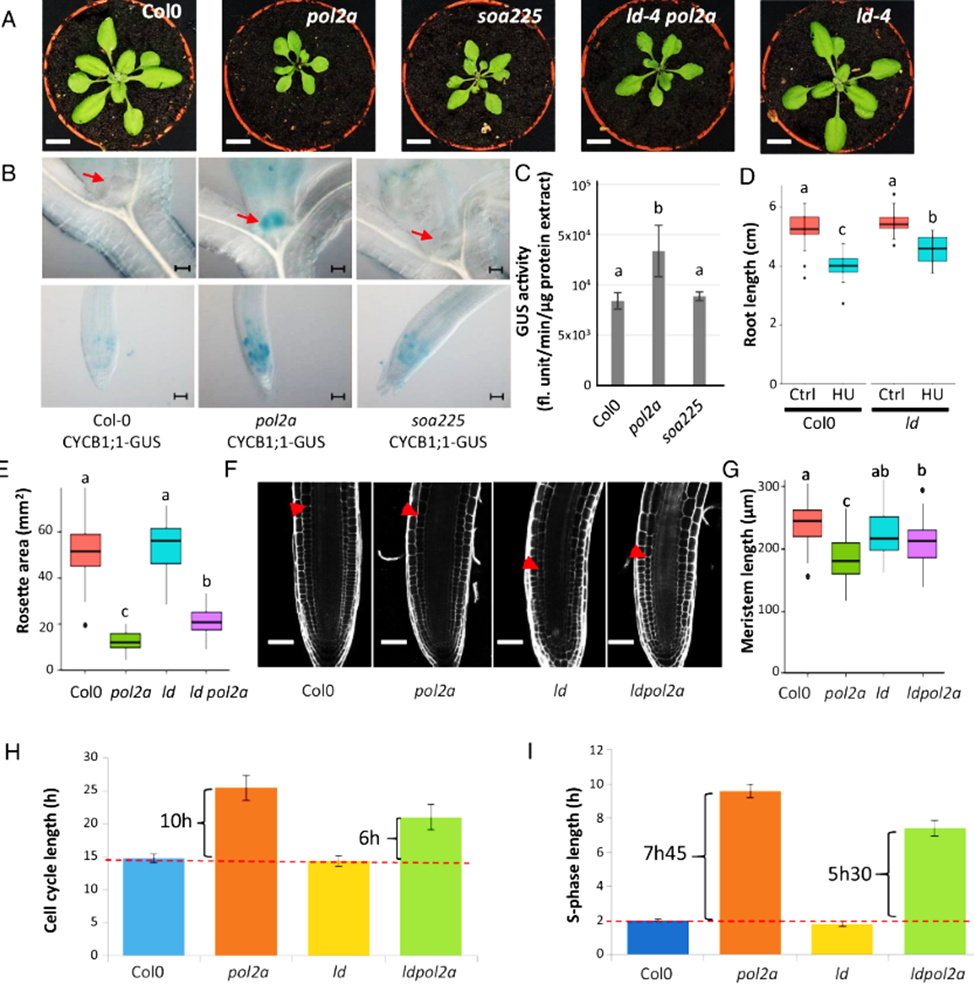
Figure 1:
LD is involved in replication stress response. (A) Phenotype of WT (Col0), pol2a, ld, soa225, and ld pol2a plants. Pol2a mutants display reduced size, soa225 is the suppressor of pol2a isolated in the genetic screen, showing partial restoration of the pol2a growth defects. The ld mutant corresponds to the SAIL line SAIL_743_B07 which harbors a T-DNA insertion in the ld gene. Plants were grown in vitro for 10 d, and on soil for 14 d. (Scale bar, 1 cm for all panels.) (B) GUS-staining pattern obtained in the different mutant lines expressing the CYCB1-1:GUS construct. Red arrows indicate shoot meristems. GUS staining was increased in pol2a mutants and returned to lower levels in the soa225 mutant. (Scale bar, 50 µm for all panels.) (C) Quantification of GUS activity (fluorescence unit/minute/µg of protein extract) in the indicated genotypes. Values are average +/- SD of three biological replicates; different letters indicate significantly different values (Wilcoxon sum-ranked test). (D) Root length measurement of 10-d-old Col0 and ld plantlets grown on ½ MS supplemented or not with hydroxyurea (HU, 1 mM). A Two-way ANOVA test was performed to compare genotypes, followed by a Tukey HSD test for multiple comparisons. Letters represent statistically different groups (P-value < 0.05, n > 20). This result is representative of 3 independent experiments. (E) Rosette area measurement of 24-d-old plants of the indicated genotypes. A Kruskal–Wallis test was performed to compare the genotypes, followed by a Wilcoxon rank-sum exact test for pairwise comparisons. Letters represent statistically different groups (P-value < 0.05, n ≥ 45). The partial restoration of ld pol2a phenotype seen in this graph is representative of 3 independent experiments. (F) Confocal images of 10-d-old meristems. Cell walls were stained with propidium iodide (10 µg/mL). Red arrows show the end of the meristematic zone. (Scale bar, 50 µm for all panels.) (G) Meristem length measurement of 10-d-old plantlets. A Two-way ANOVA test was performed to compare genotypes, followed by a Tukey HSD test for multiple comparisons. Letters represent statistically different groups (P-value < 0.05, n ≥ 34). This result is representative of 3 independent experiments. (H) Cell cycle length. (I) S-phase length in the indicated genotypes. The red dotted lines show cell cycle and S-phase length duration in the wild-type (Col-0). The error bars represent the SD between two independent experiments.
Views: 172