

Integrated transcriptomics and metabolomics analyses reveal key pathway responses during the grain-filling stage in maize under waterlogging stress
Bujin Zhou, Shaoli Wei, Jiaming Qin, Jiaxing Zheng, Bingwei Wang, Xiu Zhong, Anxia Huang, Jingdan He, Chengqiao Shi
Front Plant Sci.; 2026 Jan 19: 16:1698890. doi: 10.3389/fpls.2025.1698890.
Abstract
Crop tolerance to waterlogging significantly influences survival and productivity under waterlogging conditions. Elucidating the molecular mechanisms underlying waterlogging tolerance could facilitate the development of resilient crop varieties through breeding. This study conducted a comparative analysis of the physiological, transcriptional, and metabolic responses of a waterlogging-tolerant maize genotype Guidan162 (GD) and a waterlogging-sensitive genotype Zhaofeng 588 (ZF) during the grain filling stage. Phenotypic and physiological characteristics indicated that the leaf morphology of maize plants is affected, while the levels of peroxidase (POD) and catalase (CAT) and proline significantly increase under waterlogging stress. Transcriptomic analysis identified 3280 and 2260 differentially expressed genes (DEGs) between normal and waterlogged conditions in GD and ZF, respectively. KEGG enrichment analysis of DEGs revealed that pathways related to plant stress tolerance were enriched, including peroxisome, plant hormone signal transduction, and arginine and proline metabolism. In addition, metabolomic profiling revealed 359 and 209 differentially abundant metabolites (DAMs) in GD and ZF under waterlogging stress. Many of these DAMs participate in arginine and proline metabolism, plant signal transduction, and glutathione metabolism. Integrated transcriptomic and metabolomic analyses highlighted significant enrichment in abscisic acid (ABA) signaling, glutathione metabolism, and proline biosynthesis pathways. Several key candidate genes-including Arginase, PIP, P4H, PYR/PYL, PP2C, SnRK2, ABF, IDH, GPX, GGCT, OXP, and GCL were implicated in conferring waterlogging tolerance. These findings provide new insights into the complex molecular mechanisms of waterlogging tolerance in maize.
See https://pubmed.ncbi.nlm.nih.gov/41635687/
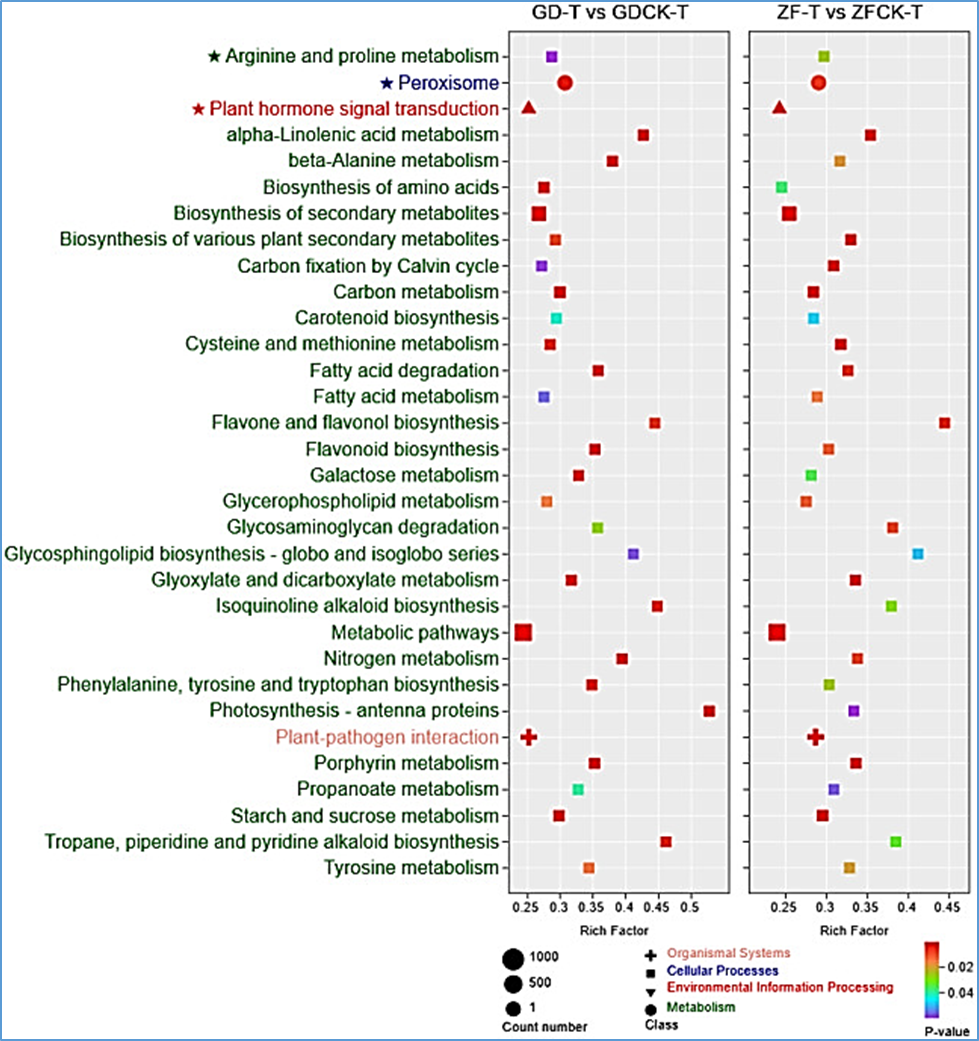
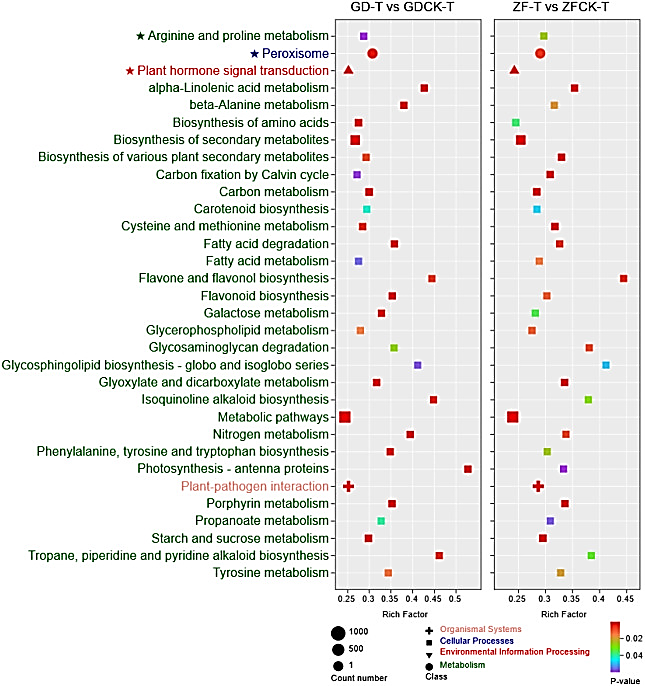 Figure 3: KEGG enrichment analysis of DEGs in GD-T vs GDCK-T and ZF-T vs ZFCK-T. The horizontal axis represents the enrichment factor. A larger factor indicates a greater degree of enrichment. The vertical axis represents the KEGG pathways. The bubble shape denotes the category of the enriched pathway, and the bubble size corresponds to the number of enriched DEGs in the pathway.
Views: 75