

Harnessing historical genebank data to accelerate pea breeding
Lanique Niels, Jochen Christoph Reif, Lars-Gernot Otto, Vilson Mirdita, Markus Oppermann, Ulrike Lohwasser, Matthias Kotter, Stephan Weise & Samira El Hanafi
Theoretical and Applid Genetics; September 9 2025; vol. 138; article 243
Abstract
The German Federal Ex Situ Genebank for Agricultural and Horticultural Crops (IPK) harbours over 3000 pea plant genetic resources (PGRs), backed up by corresponding information across 16 key agronomic and economical traits. The unbalanced structure and inconsistent format of this historical data has precluded effective leverage of genebank accessions, despite the opportunities contained in its genetic diversity. Therefore, a three-step statistical approach founded in linear mixed models was implemented to enable a rigorous and targeted data curation. Spring accessions revealed considerable breeding potential, with protein content exceeding market standards by almost one-fifth and with hundred grain weight that could match the upper limits reported for European elite varieties. This variation is embedded within structured populations, comprising five convarieties including sugar snaps and field pea, adding value for breeding across diverse morphotypes and market segments. Winter accessions demonstrated cold resilience, with post-winter survival rate up to 79.27% under minimum temperatures as low as − 17.1 °C. This variation is of particular relevance given the limited availability of winter-hardy cultivars able to evade summer drought and heat stresses. Transformation of the IPK Genebank into a bio-digital resource redirects formerly static material into central leverage for plant breeding in view of contemporary challenges. As such, this investigation activated the IPK pea population for use in among others breeding for a wide variety of ideotypes, research into adaptation, and future combination with omics studies.
See https://link.springer.com/article/10.1007/s00122-025-05032-5
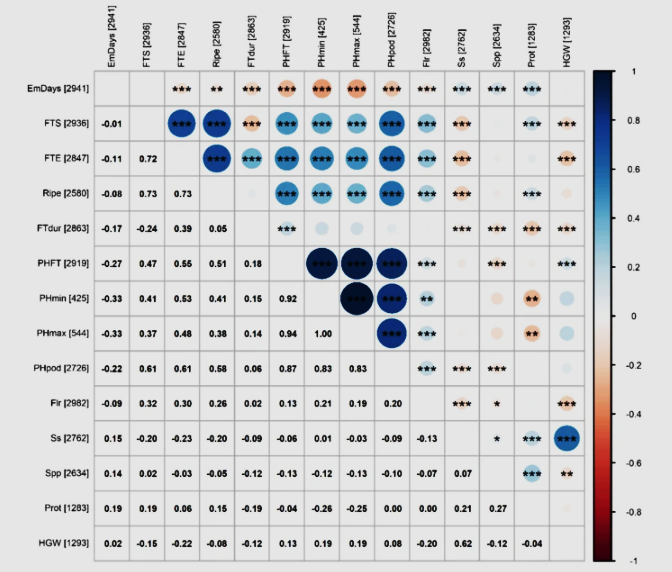
Figure 6:
Trait correlations in the spring pea population based on the estimated BLUEs. Spearman’s correlation coefficients between traits are shown below the diagonal; corresponding visualizations using coloured symbols are shown above. Numbers in parentheses indicate the number of BLUEs available for each trait. Asterisks denote significance after Holm’s multiple testing correction (p < 0.05, p < 0.01, p < 0.001). Colour and size of the circles reflect the strength and direction of the correlation, with blue indicating positive and red negative associations. EmDays = days to emergence (days since March 1th), FTS = start of flowering (days since March 1th), FTE = end of flowering (days since March 1th), Ripe = date of picking ripeness (days since March 1th), FTdur = duration of flowering (days since March 1th), PHFT = plant height at flowering time (cm), PHmin = minimum plant height (cm), PHmax = maximum plant height (cm), PHpod = height of the first pod (cm), Flr = number of flowers per inflorescence, Ss = seed size, Spp = number of seeds per pod, Prot = protein content (%), HGW = hundred grain weight (g)
Views: 133