

Culinary secrets of sweet potatoes: A metabolomic perspective
Jiahao Zhang, Wenhao Zhong, Bolin Wei, Biao Zhao, Yanyue Liang, Yihang Jiang, Tongxian Zhou, Jiatong Han, Zixian Wu, Honglin Yang, Shunhong Feng, Wenyi Wang, Mengyun Xu
Food Chem.; 2026 Jan 1; 498(Pt 1):147145. doi: 10.1016/j.foodchem.2025.147145.
Abstract
Sweet potato is a globally important root crop known for its exceptional nutritional density. Various cooking methods, such as baking, boiling, and steaming, are used to enhance palatability and modify functional properties. Here, we explored the effects of culinary techniques in sweet potatoes. A total of 3794 non-volatile metabolites were identified across raw and cooked samples, providing a comprehensive metabolic snapshot of sweet potato under different processing conditions. Specifically, 1776, 1688, and 1662 DEMs were identified in steamed, boiled, and baked samples compared to raw controls. Kyoto Encyclopedia of Genes and Genomes (KEGG) enrichment analysis revealed that downregulated DEMs enriched a series of pathways, such as linoleic acid metabolism. Notably, steaming as a thermal processing method, influences carotenoid stability, bioavailability, and color retention. Additionally, pathways linked to nucleotide metabolism and nucleotide sugar biosynthesis were impacted. Collectively, these findings underscore the complex interplay between culinary processing and metabolic reprogramming in sweet potatoes.
See https://pubmed.ncbi.nlm.nih.gov/41275552/
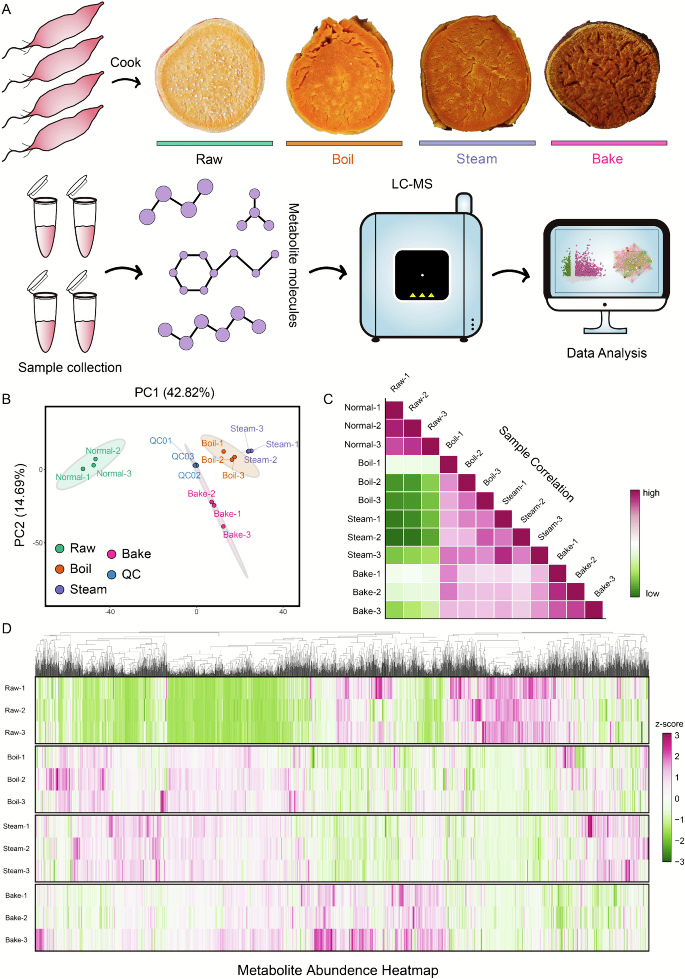
Fig. 1. Morphological observations and metabolic analysis of sweet potatoes under different cooking methods. (A) Experimental design. Different cooking treatments were applied to the high-carotenoid sweet potato cultivar PS32, including control (Raw), boiling (Boil), steaming (Steam), and baking (Bake), and cross-sectional images for each treatment method were obtained. Subsequently, each group of samples was subjected to liquid chromatography-tandem mass spectrometry (LC-MS/MS) analysis to identify and quantify metabolites. Bioinformatic analysis was performed to reveal the effects of different cooking treatments on metabolite dynamics. (B) Principal component analysis (PCA) under different cooking methods. Each point represents a sample, and samples from the same group are indicated with the same color. (C) Sample-to-sample correlation heatmap under different cooking methods. Deep purple indicates high correlation, while deep green indicates low correlation. (D) Relative abundance heatmap of all metabolites. Horizontal axis represents sample names, vertical axis represents metabolite information. Different colors indicate different values obtained after z-score normalization (purple represents high level, and green represents low level). (For interpretation of the references to color in this figure legend, the reader is referred to the web version of this article.)
Views: 96