

Identifying canopy wilting QTLs and evaluating remote sensing approaches for selecting drought-tolerant soybean
Nathaniel Burner, Price Pius Atuah Akiina, Qijian Song, Donna K. Harris & Zenglu Li
Theoretical and Applied Genetics; October 14 2025; vol. 138, article 276
Abstract
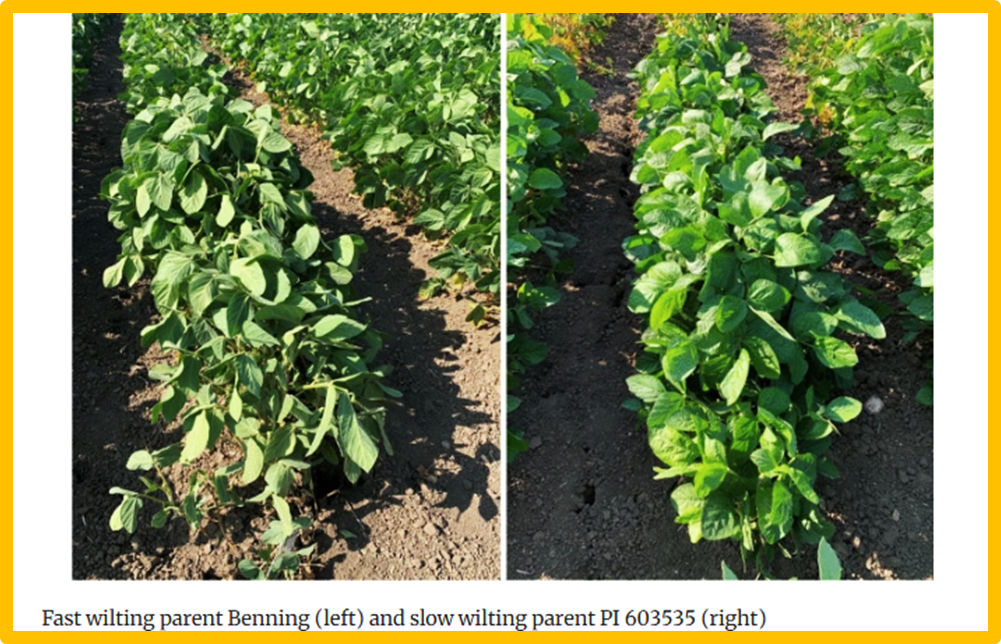
Drought is the most damaging abiotic stress for soybean yield; cultivars with improved drought tolerance are needed to sustain and increase crop production. PI 603535 previously was identified as an ultra-slow canopy wilting (CW) line in a genome-wide association study but the quantitative trait loci (QTLs) underlying this phenotype have not been determined. In this study, a recombinant inbred line (RIL) population derived from Benning × PI 603535 was evaluated for three years under rain-fed conditions. CW was rated following extended periods of drought when CW variation was present. Aerial multispectral and thermal imagery was also captured in conjunction with visual ratings to explore the feasibility of implementing remote sensing to improve the efficiency and objectivity of drought evaluations. The normalized difference vegetation index (NDVI) and green-based NDVI (GNDVI) exhibited strong, significant correlations (|r|= 0.42–0.44) with CW across years. CW scores and the remote sensing traits were used as phenotypes for QTL mapping. Seven CW QTLs were identified across six chromosomes in the combined analysis, with NDVI and GNDVI QTLs generally colocalizing with the CW QTLs with the highest percentage of variation explained (PVE). The QTLs were not consistently identified among individual years, highlighting the complex genetics and gene expression of drought tolerance. The instability and low additive effect estimates of individual QTLs imply challenges of improving drought tolerance through the selection of a few QTLs. However, the slow CW RILs developed in this study can serve as valuable breeding stocks for future drought improvement breeding efforts and genetic studies.
See https://link.springer.com/article/10.1007/s00122-025-05063-y
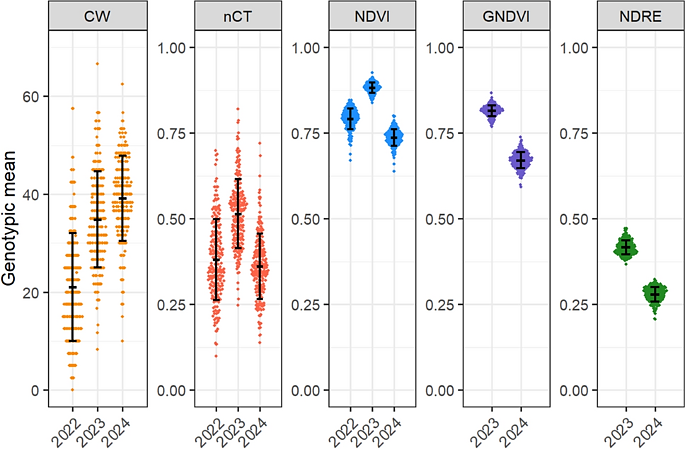
Figure 2. Distribution of genotypic means for CW scores and nCT, NDVI, GNDVI, and NDRE measurements. nCT is the relative CT among genotypes within each year and NDVI, GNDVI, and NDRE indicate the proportion of NIR reflectance relative to red, green, and red edge reflectance, respectively, with higher values indicating healthier and denser canopies. Error bars indicate the mean and standard deviation for each trait × year combination. 2022 remote sensing traits were collected with handheld devices, whereas 2023–2024 was collected from UAVs (CW = Canopy wilting; nCT = Normalized canopy temperature; NDVI = Normalized difference vegetation index; GNDVI = Green-based normalized difference vegetation index; NDRE = Normalized difference red edge index).
Views: 144