

Histone deacetylase-1 is required for epigenome stability in Neurospora crassa
Felicia Ebot-Ojong, Aileen R. Ferraro, Rochelle E. Yap, Farh Kaddar, Clayton Hull-Crew, Ashley W. Scadden, Abigail M. Deaven, Andrew D. Klocko, and Zachary A. Lewis
PNAS; September 29, 2025; 122 (40) e2503876122; https://doi.org/10.1073/pnas.2503876122
Significance
In eukaryotes, certain regions of the genome are packaged into specialized heterochromatin domains. Constitutive heterochromatin forms at repeat-rich DNA where it represses selfish genetic elements such as transposons. In contrast, facultative heterochromatin represses context- or lineage-specific genes. Remarkably, both constitutive and facultative heterochromatin states can be maintained over the lifetime of an organism by histone modifications and histone modifying enzymes that form positive feedback loops. Here, we report that mutation of histone deacetylase-1, a constitutive heterochromatin-specific enzyme, leads to progressive epigenome defects in constitutive and facultative heterochromatin. This work highlights a critical role for histone deacetylation in maintenance of epigenome structure and provides a model for defective heterochromatin maintenance associated with human disease states.
Abstract
Polycomb group (PcG) proteins form chromatin modifying complexes that stably repress lineage- or context-specific genes in animals, plants, and some fungi. Polycomb Repressive Complex 2 (PRC2) catalyzes trimethylation of lysine 27 on histone H3 (H3K27me3) to assemble repressive chromatin. In the model fungus Neurospora crassa, H3K27me3 deposition is regulated by the H3K36 methyltransferase ASH1 and components of constitutive heterochromatin including the H3K9me3-binding protein HETEROCHROMATIN PROTEIN 1 (HP1). Hypoacetylated histones are a defining feature of both constitutive heterochromatin and PcG-repressed chromatin, but how histone deacetylases (HDACs) contribute to normal H3K27me3 and transcriptional repression within PcG-repressed chromatin is poorly understood. We performed a genetic screen to identify HDACs required for repression of PRC2-methylated genes. In the absence of HISTONE DEACETYLASE-1 (HDA-1), PRC2-methylated genes were activated and H3K27me3 was depleted from typical PRC2-targeted regions. At constitutive heterochromatin, HDA-1 deficient cells displayed reduced H3K9me3, hyperacetylation, and aberrant enrichment of H3K27me3 and H3K36me3. CHROMODOMAIN PROTEIN-2 (CDP-2) is required to target HDA-1 to constitutive heterochromatin and is also required for normal H3K27me3 patterns. Patterns of aberrant H3K27me3 were distinct in isogenic ∆hda-1 strains, suggesting that loss of HDA-1 causes stochastic or progressive epigenome dysfunction. To test this, we constructed a new Δhda-1 strain and performed a laboratory “aging” experiment. Deletion of hda-1 led to progressive epigenome decay over hundreds of nuclear divisions. Together, our data indicate that HDA-1 is a critical regulator of epigenome stability in N. crassa.
See https://www.pnas.org/doi/10.1073/pnas.2503876122
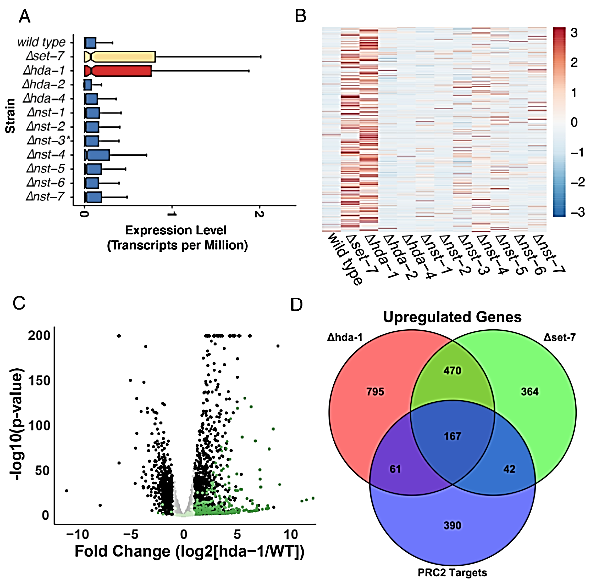
Figure 1
HDA-1 is required for the repression of PRC2-methylated genes. (A) The boxplots show the average level of expression for all PRC2-target genes (n = 679) for the indicated strains, with the x-axis values corresponding to log2-transformed transcripts per million (TPM) read counts. Lines represent the median expression value, and the notches indicate the 95% CI. The ∆nst-3 strain was determined to be a heterokaryon and is labeled with an asterisk. (B) The heatmap shows relative expression levels of each PRC2-target gene for the indicated strains (n = 537 genes expressed in at least one strain). (C) The volcano plot shows differentially expressed genes for wild type and Δhda-1. Dark green spots correspond to PRC2-methylated genes that meet fold-change and statistical thresholds (log2[fold change] ± 1.5 and an adjusted P-value < 0.05). Black spots correspond to non-PRC2 methylated genes that meet the same fold-change and statistical threshold. Genes that do not meet statistical or fold-change thresholds are colored in pale green for PRC2-target genes or gray for non-PRC2 targets. (D) The Venn Diagram illustrates overlap between PRC2 target genes and genes upregulated in the ∆hda-1 or ∆set-7 strains.
Views: 184