

Genetic, phenotypic, and environmental drivers of local adaptation and climate change–induced maladaptation in a migratory songbird
Marina D. Rodriguez, Christen M. Bossu, Eric C. Anderson, Rachael A. Bay, and Kristen C. Ruegg
PNAS; September 29 2025; 122 (40) e2518497122;
EVOLUTION https://doi.org/10.1073/pnas.2518497122
Significance
As climate change alters environments, many wild populations are struggling to keep up. However, empirical examples of what happens when genotype and phenotype fail to track environmental change remain rare. Here, we identify genetic and environmental factors shaping bill morphology in a migratory bird and show that birds whose bills are failing to keep pace with changes in local climate are exhibiting greater physiological stress. By integrating historical DNA, genome-wide data, morphology, and telomere length as a biomarker of stress, this work provides rare empirical evidence of contemporary maladaptation in the wild. These findings highlight the importance of linking genes, traits, and environment to understand species’ responses to rapid climate change.
Abstract
Understanding processes driving local adaptation in wild species is a key goal in evolutionary biology, but linking genotype to phenotype to environmental drivers of natural selection remains challenging. Even more rare are empirical examples of what happens when genotype and phenotype fail to keep pace with environmental change. Here, we explore these connections by conducting an integrative study on the breeding range of the yellow warbler (Setophaga petechia). Using genome-wide association studies (GWAS), we first identify loci associated with variation in bill morphology and individual quality. We then employ gene–environment association (GEA) analyses and find that precipitation is a key environmental driver of putative selection on bill shape. Finally, we test whether contemporary individuals whose bill shapes deviate from the historical relationship with precipitation experience increased stress (measured by telomere length) as a result of maladaptation. We also use historical DNA to test whether local populations have shifted their ranges over the past century, confirming that the observed changes are not due to range shifts. Our results align with predictions from GWAS and GEA analyses, indicating that birds with shallower bills in increasingly arid regions suffer higher stress (i.e., shorter telomeres) because of maladaptation. Overall, this study links genetic, phenotypic, and environmental data with stress biomarkers to improve understanding of the process of local adaptation and the consequence of failing to keep pace with changing climate conditions.
See https://www.pnas.org/doi/10.1073/pnas.2518497122
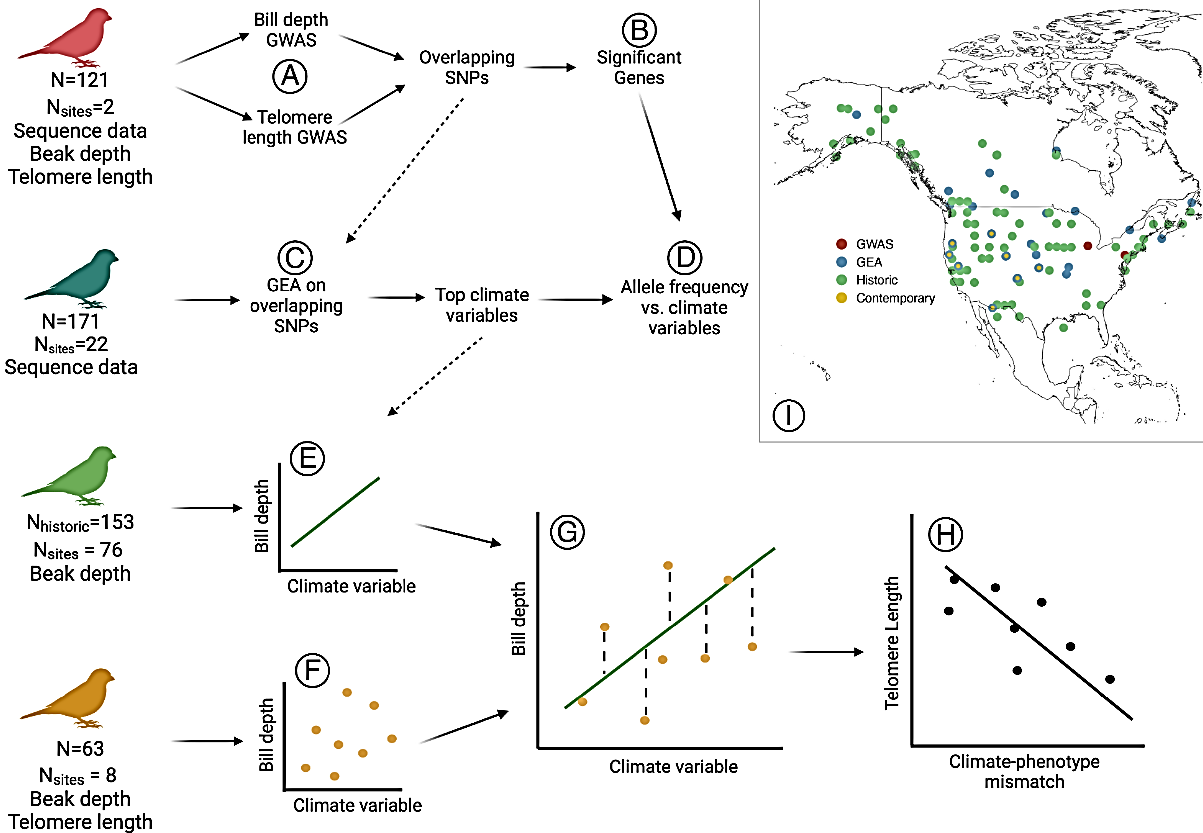
Figure 1:
Workflow for study connecting the genotype, phenotype, and environmental components of local adaptation in the yellow warbler (S. petechia), as well effects of maladaptation to climate change. (A) We first conduct two separate GWAS on 121 reference individuals from one genetically distinct population to identify a suite of loci related to both bill depth and telomere length. (B) Using the results of the GWAS, we find overlapping SNPs with nonzero effects on both bill depth and telomere length. For SNPs with significant effects on at least one of the phenotypes of interest, we then investigate associated genes. (C) On the overlapping SNPs from both GWAS, we then run a GEA on 171 individuals from across the yellow warbler range to find environmental variables associated with bill depth and telomere length-associated genomic variation. (D) We then aim to validate the significant genes found in (B) by looking at the relationship between allele frequencies and values of the top climate variables found in (C). (E) Using 153 historic yellow warbler samples from across the breeding range, we then analyzed the relationship between bill depth and the top climate variable from (C), to find the line of best fit. (F) Similarly, we looked at 63 contemporary yellow warbler samples from across the breeding range (samples overlap from C) and analyzed the relationship between bill depth and the top climate variable from (C). (G) We then measured the distance from the line of best fit in (E) to each point in (F) to quantify climate–phenotype mismatch. (H) Finally, we analyze the association between climate–phenotype mismatch and telomere length to find whether distance from the optimal climate–phenotype association is negatively associated with individual quality as we predict. (I) Samples span the breeding range of the yellow warbler. The map shows the distribution of the samples for each of associated analysis. The contemporary samples are yellow with a blue border as they are samples also used in the GEA.
Views: 162